Note: CyberSight is an agent-based solution designed for comprehensive cybersecurity monitoring. However, it does not support network filtering. Additionally, CyberSight is currently not compatible with macOS and Safari
Welcome to the guide on enabling a powerful feature and accessing insightful reports with ease. In this walkthrough, we'll lead you through the steps to activate this feature and utilize its comprehensive reporting capabilities. By following these instructions, you'll harness the full potential of this tool to gain valuable insights into user behavior and enhance your organization's security posture. Whether you're configuring settings, accessing reports, or exploring user activity, you're on your way to making informed decisions and optimizing your cybersecurity efforts. Let's get started.
Navigation: Enabling CyberSight | Activity Overview | Weekly Activity | Timeline
Enabling CyberSight
To enable CyberSight and access reports, follow these steps:
Step 1. Select the Customer you want to enable CyberSight on and navigate to the "Endpoints" tab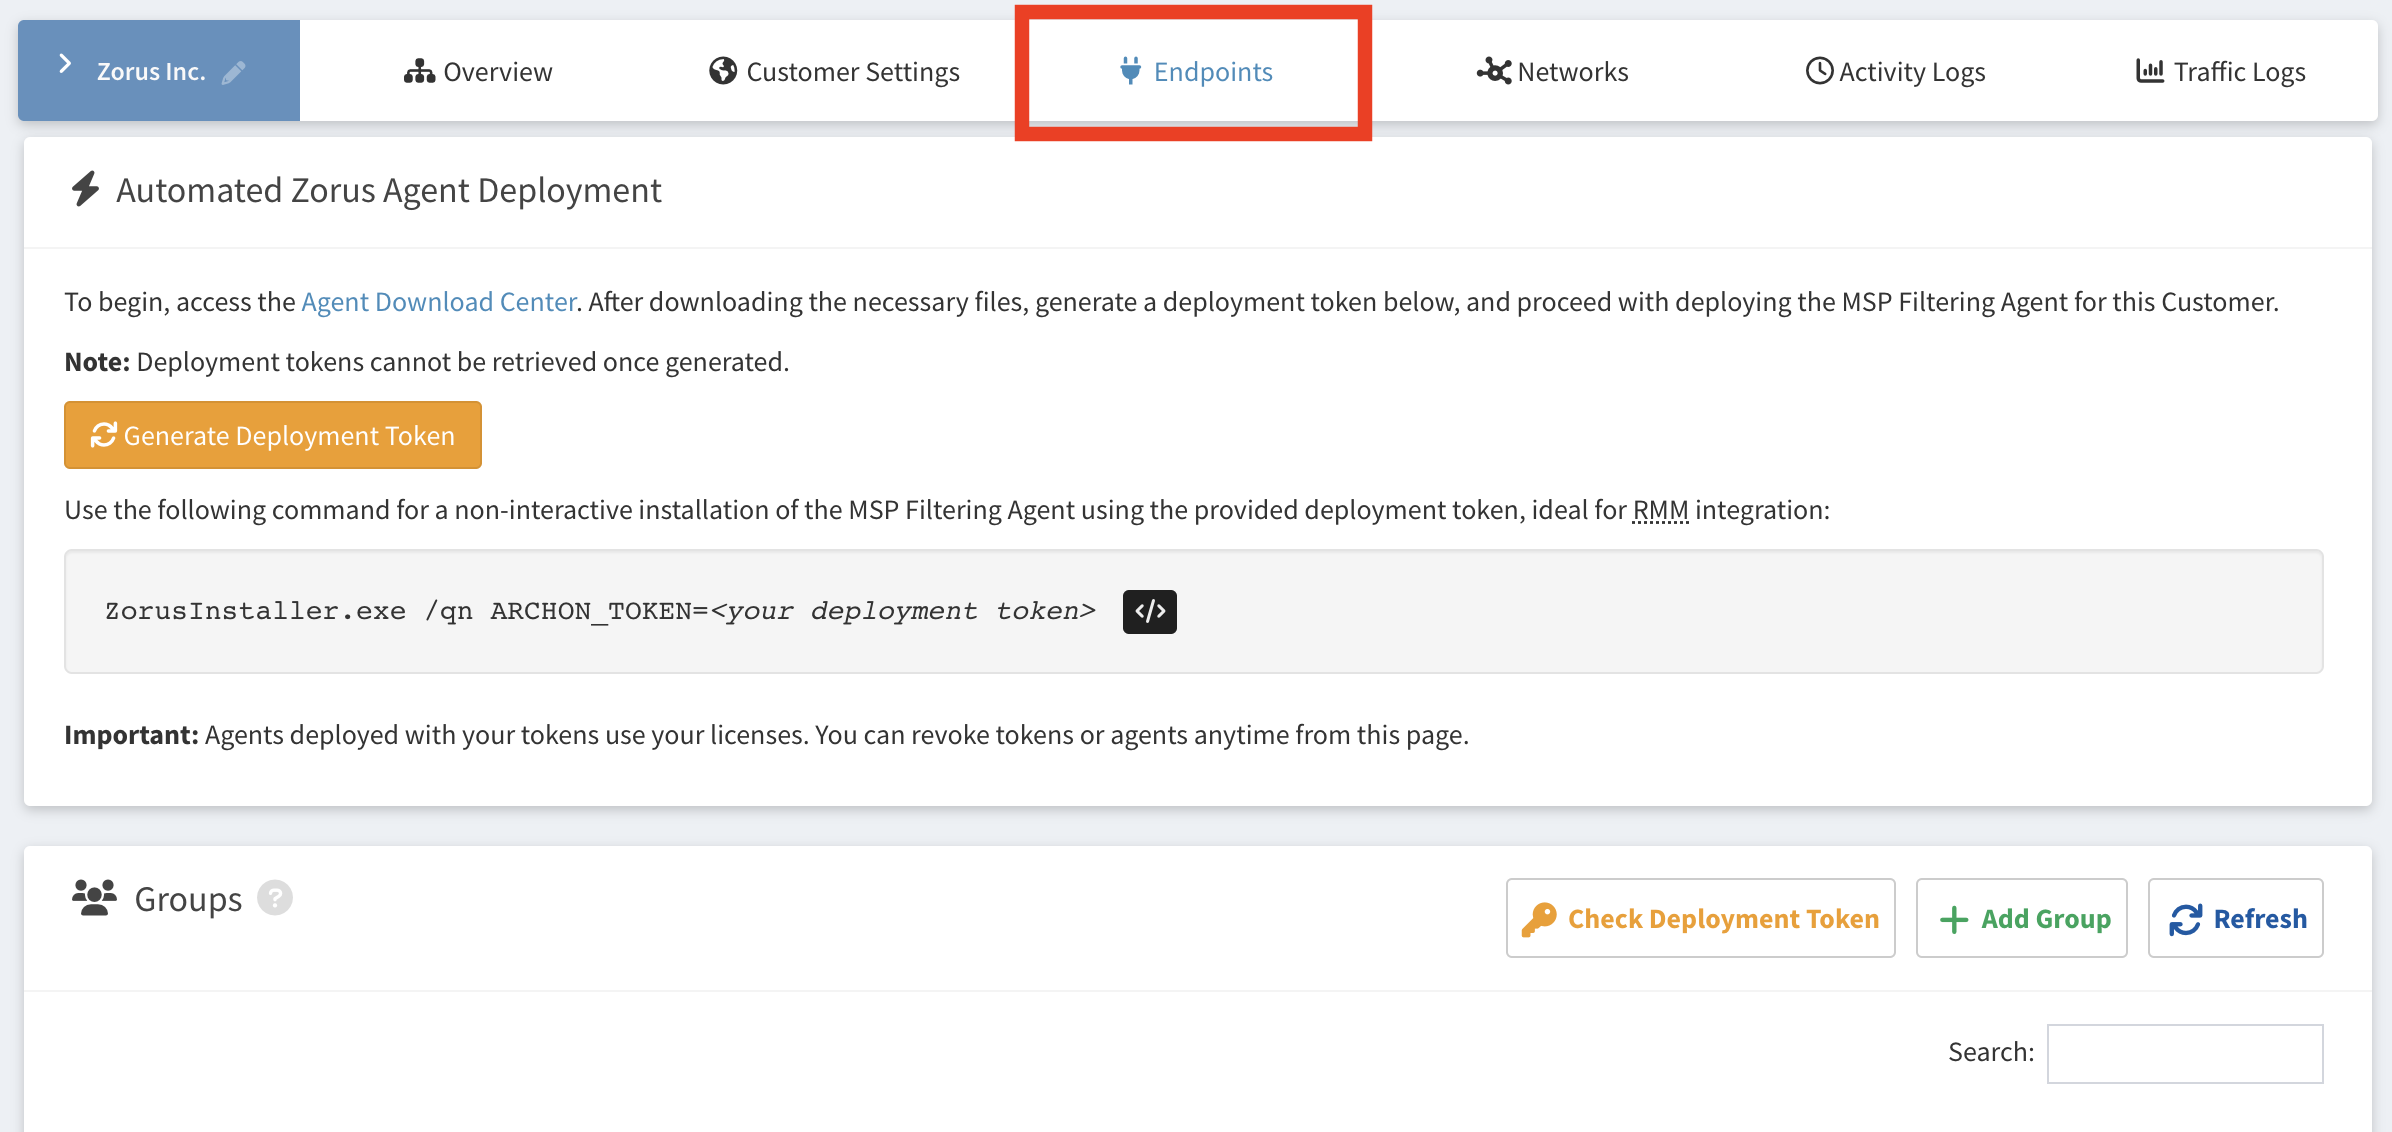
Step 2. Next, click the "Edit" button beside the Group(s) or Endpoint(s) you want to enable CyberSight for

Step 3. When you click the group edit button, a screen with various permissions appears. To enable CyberSight for the entire group, toggle the "Enable CyberSight" option, check the "Sync these permissions to everything in this group" box, and click "Save Group" to apply the permission to all endpoints within that group.

If you prefer to enable it on an individual endpoint or a few selected endpoints, you'll be presented with a screen like the one below.

Just like in Group settings, simply check the "Enable CyberSight" toggle for an individual endpoint, and then click "Save Endpoint" since there are no syncing permissions for singular endpoints.
Step 4. Finally, verify that the setting is enabled by checking for a small clock icon under the permissions column, located next to the group(s) or endpoint(s) where you activated CyberSight. If you enabled it for a group containing multiple endpoints, you'll see the icon in both the Groups and Endpoints sections, next to the respective endpoints.

Activating the Browser Extension for Full URL Context
Elevate the power of CyberSight with our Browser Extension, giving you a complete view of user activity through full URL context. To get started, explore our step-by-step guide here.
CyberSight Reports
Note: Please be aware that the provided reporting metrics/data are based on user interactions with actively used browser tabs and windows. This may result in a shorter timeline than expected, as CyberSight records only active actions. If no actions or streaming are detected within a 2-minute interval, it will be marked as idle. Background tabs and windows will not be reflected in the reporting metrics/data.
Customer Activity Overview
The Customer Activity Overview offers a comprehensive snapshot of user behavior and technological patterns within a customer's organization. This tool provides valuable insights into how time is allocated across the business, offering a deep understanding of SaaS application usage, the detection of shadow IT, and the evaluation of active license utilization. It serves as a crucial resource for engaging in meaningful conversations with customers, enabling businesses to provide advice and optimize their operations. By gaining a clear picture of where time and resources are being invested, this feature greatly facilitates executive reporting and enhances the quality of Quarterly Business Reviews (QBRs).
Accessing Customer Activity Overview- Navigate to the CyberSight left menu and select Overview
- Select the relevant Customer and customize the date range according to your preferences. Additionally, you have the option to apply filters to specific Endpoints if you want to narrow your focus.
- An interactive dashboard will load in real time, allowing you to analyze the data.
- From the ellipsis menu, you can easily download the report in PDF format for your convenience.

This dashboard is available as a report in the Report Library for scheduling at regular intervals or on-demand.
Endpoint Weekly Activity
The Endpoint Weekly Activity view provides valuable insights into the top applications and URLs used each week on a specific endpoint, complete with time spent. You can interactively filter this weekly activity by day and conveniently download the report in PDF format. It helps you better understand your organization's security risks by examining user behavior. By detecting anomalies and resource variations, you can proactively strengthen your cybersecurity defenses, making your risk assessment more effective and enabling you to mitigate potential threats.
Accessing Endpoint Weekly Activity
- Navigate to the CyberSight left menu and select Weekly Activity
- Select the relevant Customer and customize the date range according to your preferences. Additionally, you have the option to apply filters to specific Endpoints if you want to narrow your focus.
- An interactive dashboard will load in real time, allowing you to analyze the data.
- From the ellipsis menu, you can easily download the report in PDF format for your convenience.

CyberSight Timeline
Overview
Welcome to the CyberSight Timeline feature, a powerful tool designed to provide deep forensic insights with second-by-second logs. This feature allows you to start from a high-level overview and trace specific user actions effortlessly, ensuring comprehensive data security and efficient issue resolution.

Key Highlights:
- High-Level Overview: Quickly understand overall user activity at a glance.
- Detailed Activity Logs: Drill down into specific events to spot anomalies and understand each action in detail.
- Comprehensive Data: View activities across websites, applications, and streaming services.
- Intuitive Visualization: Graphs and charts provide a clear picture of user behavior and activity patterns.
With CyberSight Timeline, identifying and investigating potential issues has never been easier. Empower your data sleuths with the tools they need to ensure security and efficiency.
Events Widget
The Events widget displays a bar chart representing user activities over a selected time frame.
 This visualization allows you to:
- Identify Activity Peaks: Quickly identify when most activities occurred, helping you spot patterns and potential anomalies.
- Categorize Activities: Different colors represent different types of activities, such as website visits, application usage, and streaming services, giving you a clear picture of user behavior.
Activities Widget
The Activities widget uses a pie chart to show the distribution of time spent on various activities.

Key features include:
- Time Tracking: See exactly how much time users spend on different applications, websites, and other activities.
- Activity Breakdown: Understand which activities dominate user time, helping you manage productivity and identify potential areas of concern.
Timeline Widget
The Timeline widget offers a granular view of user activities throughout the day, represented in a timeline format.

This includes:
- Activity Types: Different colors and labels indicate various types of activities, such as active time, streaming, idle time, and machine lock/unlock events.
- Easy Navigation: Hover over specific points in the timeline to get detailed information about each activity, including the start and end times, duration, and type of activity.
Note: The Timeline only shows a granular view when filtered to a singular day. When more than 1 day is selected, it aggregates the data to total time buckets.
Example:

Activity Logs
The Activity Logs section provides a detailed tabular view of user actions.

This includes:
- Second-by-Second Logs: Trace specific user actions down to the second, providing a detailed forensic trail.
- Endpoint and User Information: See which endpoint and user are associated with each activity.
- Activity Type and Application: Identify the type of activity (e.g., webpage, application) and the specific application used.
- Website and Categories: Get URLs and categories for webpage visits, allowing you to monitor and manage web activity.
- Duration and Time Stamps: Understand how long each activity lasted and when it occurred, aiding in precise activity tracking.
How to Use CyberSight Timeline
-
Accessing the Feature:
- Navigate to the CyberSight section from the main menu.
- Select the desired Customer, Endpoint(s) and time frame to view the activity data.
-
Interpreting the Widgets:
- Use the Events widget for a high-level overview of user activities.
- Refer to the Activities widget to understand the distribution of time spent on different activities.
- Dive into the Timeline widget for high level machine state throughout the day
- Explore the Activity Logs for detailed, second-by-second logs of user actions.
-
Investigating Issues:
- Start with the high-level overview to spot unusual activity patterns.
- Drill down into specific events using the detailed insights provided by the Timeline and Activity Logs.
- Utilize the comprehensive data to understand the context and potential causes of anomalies.
By leveraging these widgets, you can gain a thorough understanding of user activities, enhance your security posture, and ensure efficient issue resolution. CyberSight Timeline is your go-to tool for deep forensic insights and effective activity monitoring.